
Intell-i-Watch IW-101012
20-channel monitor · multi-sensor monitoring and analysis system
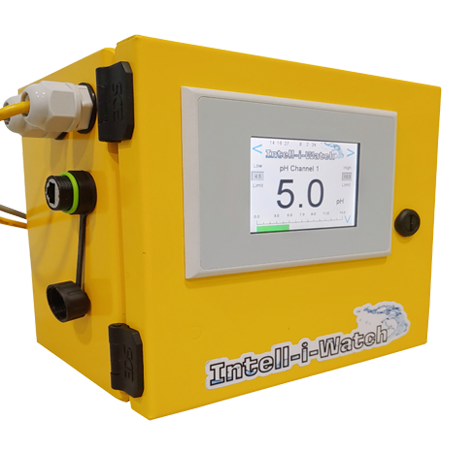
IW-101012
Part number: IW101012UB
- 20 channels (10 analog, 10 digital)
- Screen 5”
- Datalogging and multi-level passwords
- Ethernet networkable; view on cell, tablet or PC
IW-101012 quick-spec
The Intell-i-Watch Model IW-101012 comes standard with a 5" display, 20 sensor channels - 10 analog and 10 digital. 32GB SD, 32GB flash memory. Customizable.
| Channels | 20 (10 analog, 10 digital) |
|---|---|
| Configurable | Yes, all channels customizable |
| Dimensions | 10” × 10” × 6” |
| Screen size | 5” |
| Screen type(s) | Cell, tablet, PC can be used |
| Ethernet | Yes, networkable |
| Memory | 32 GB SD card, 32 GB+ flash |
| Weight | 14 lbs |
| Voltage | 115 V, 1-phase, 50/60 Hz |
| Datalogging | Yes |
| Password | Yes, multi-level |
Monitored devices
A partial list. Many other sensors and signals can be connected; ask us about yours.
- pH, ORP
- TSS, TDS, DO, conductivity, O&G, turbidity, metals
- Flow
- Pressure
- Level
- Many other water condition sensors
- Motor/machine conditions
- Energy conditions
Need the sensors too? See sensor options.
Product Information
Brochures
Guides
Tech notes
- Units of measure
- pH sensor selection and care
- pH neutralization and monitoring
- ORP monitoring
- Conductivity in water
- Flow monitoring tips
- Ultrasonic or radar sensor
- Energy management and Intell-i-Watch monitoring
- Monitoring generators and ATS
What does the Intell-i-Watch offer? (web page)
See all literature and sensor data sheets on the Technical & Engineering Resources page
Analysis on the Watch
Logs and analyzes on its own – no network needed. No internet, cloud service, plant or IT network, or remote access is needed for logging and analysis.
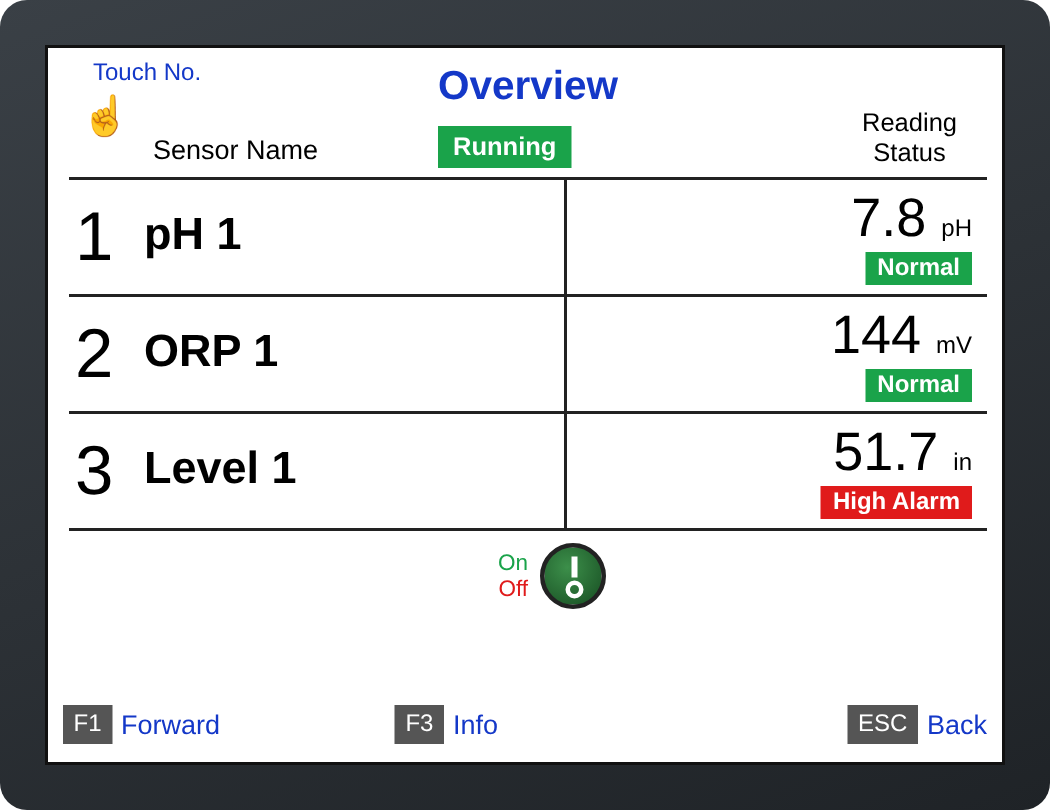
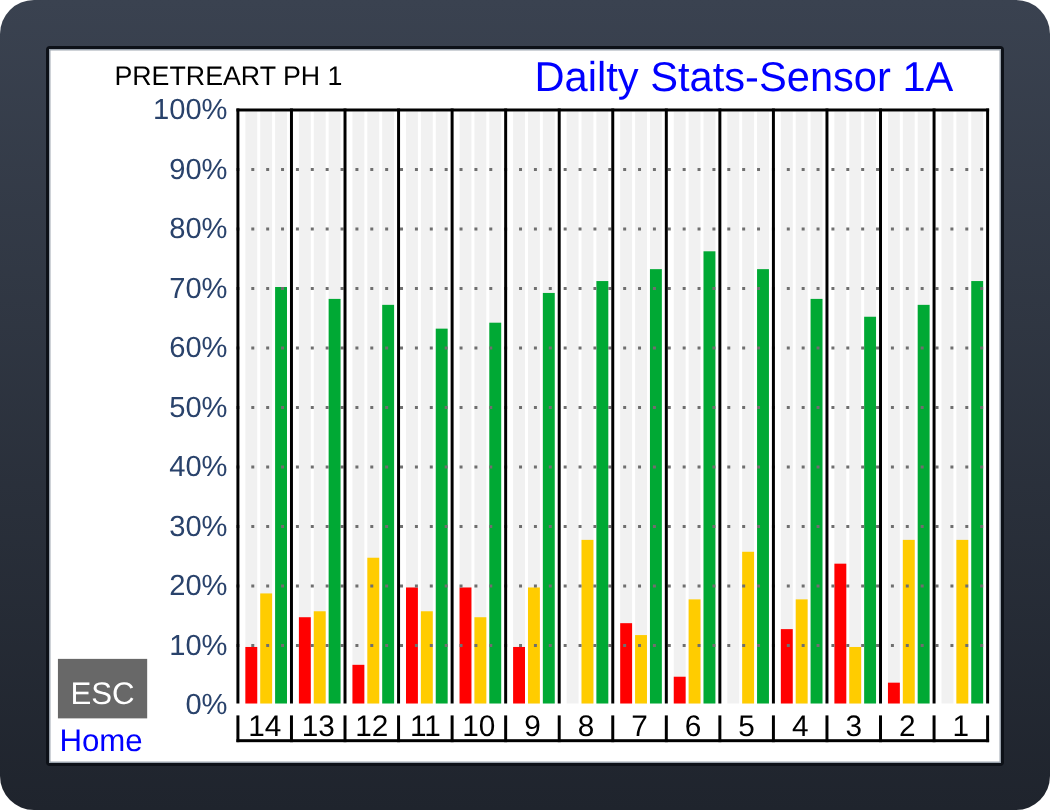
On the Watch: live readings, bar graphs, trend graphs, averages and min/max, plus logged history (trend graphs with date and time) and alarm logs on screen.
Connected features – email and text alerts, web server pages, file transfer and remote viewing – are optional and turned on only with your approval. More about standalone analysis
Other models
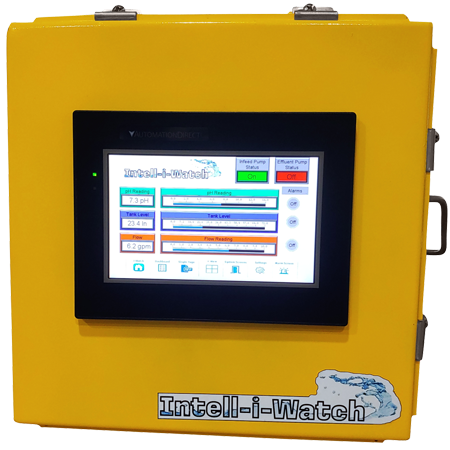
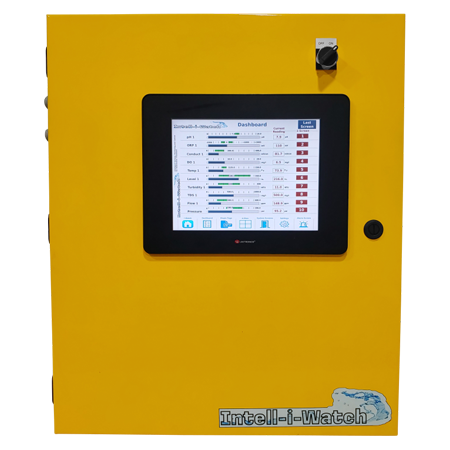
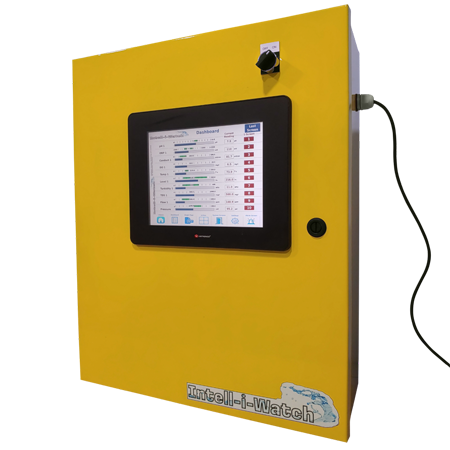
Monitor. Log. Analyze.
Data working for you
Quickly move from collecting to analyzing your data.
Monitor
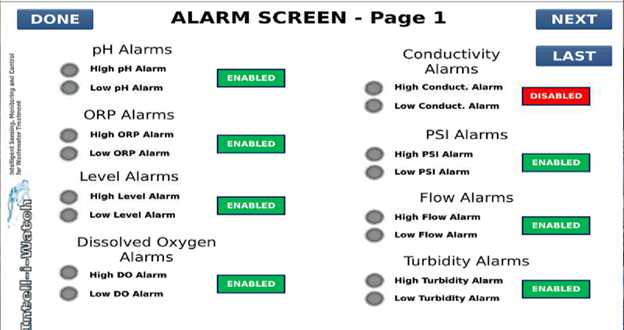
- Programmable smart alarms for any feedback signal/data origin
- Real-time data view
- Interactive sensor dashboards: graphs, analytics, histories, stats and trending
Log
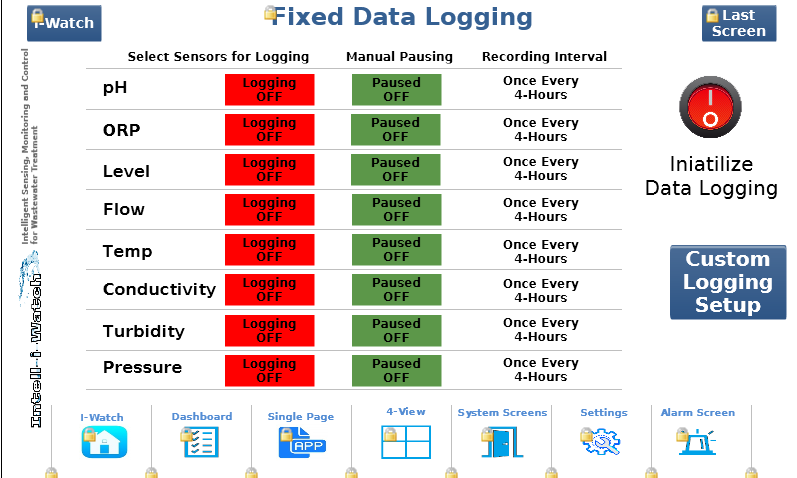
- Feedback datalogging from one or multiple sensors
- History tracking for reporting
- Create baseline KPIs for data comparisons
Analyze
- Interpret, trend and analyze the data to optimize and improve processes
- Create predictive results to improve proactive actions
- Avoid cyclical system upset
- Trend graphs: live, short-term and archived

How the Intell-i-Watch works
Your sensors in. Readings, alarms, records and analysis out.
1Your sensors
Water quality
Process
Equipment & energy
Most standard analog and on/off sensors.
2The Watch
Intell-i-Watch
Monitor. Log. Analyze.
Logs and analyzes on its own – no network needed
3What you get
See it
- Live readings
- Trend graphs
- Averages, min/max
- Monthly statistics
Get alerted
- Alarm setpoints you set
- Delays for process lag
- Email and text alerts
- Alarm outputs
Keep the record
- Date- and time-stamped logs
- Alarm log
- Logging rate set to your process
Share it
- CSV export for Excel
- Transfer by USB
- Password-protected web pages
Some features depend on the model. Network connections are optional and turned on only with your approval.
Tell us what you need to monitor
We'll match a Watch model and sensors to your application. Call 262.716.0105 or send the details and we'll follow up with a recommendation and pricing.